Characterizing at the gene expression level the impact of immunophenotype on tumor cell metabolism
Characterizing the extent of similarities and differences between tumor biopsies and a proposed experimental model (a tumor developing in an immune system-free environment: xenograft) to study the impact of immune system on tumor development
Metabolomic and transcriptomic measurement for 3 tissues types (i.e. non tumors, tumors and xenograft) coming from the same patient, for many patients
Integration of discovered metabolites and genes significantly differentially expressed/measured between those 3 tissue types, within a metabolic pathway
For a set of tumors where the immunophenotype has been previously determined, find the principal axes that differentiate those phenotypes in the gene expression space
Using over-representation analysis (hypergeometric statistics) to condense and translate transcriptomic and metabolomic data to biologically meaningful pathways
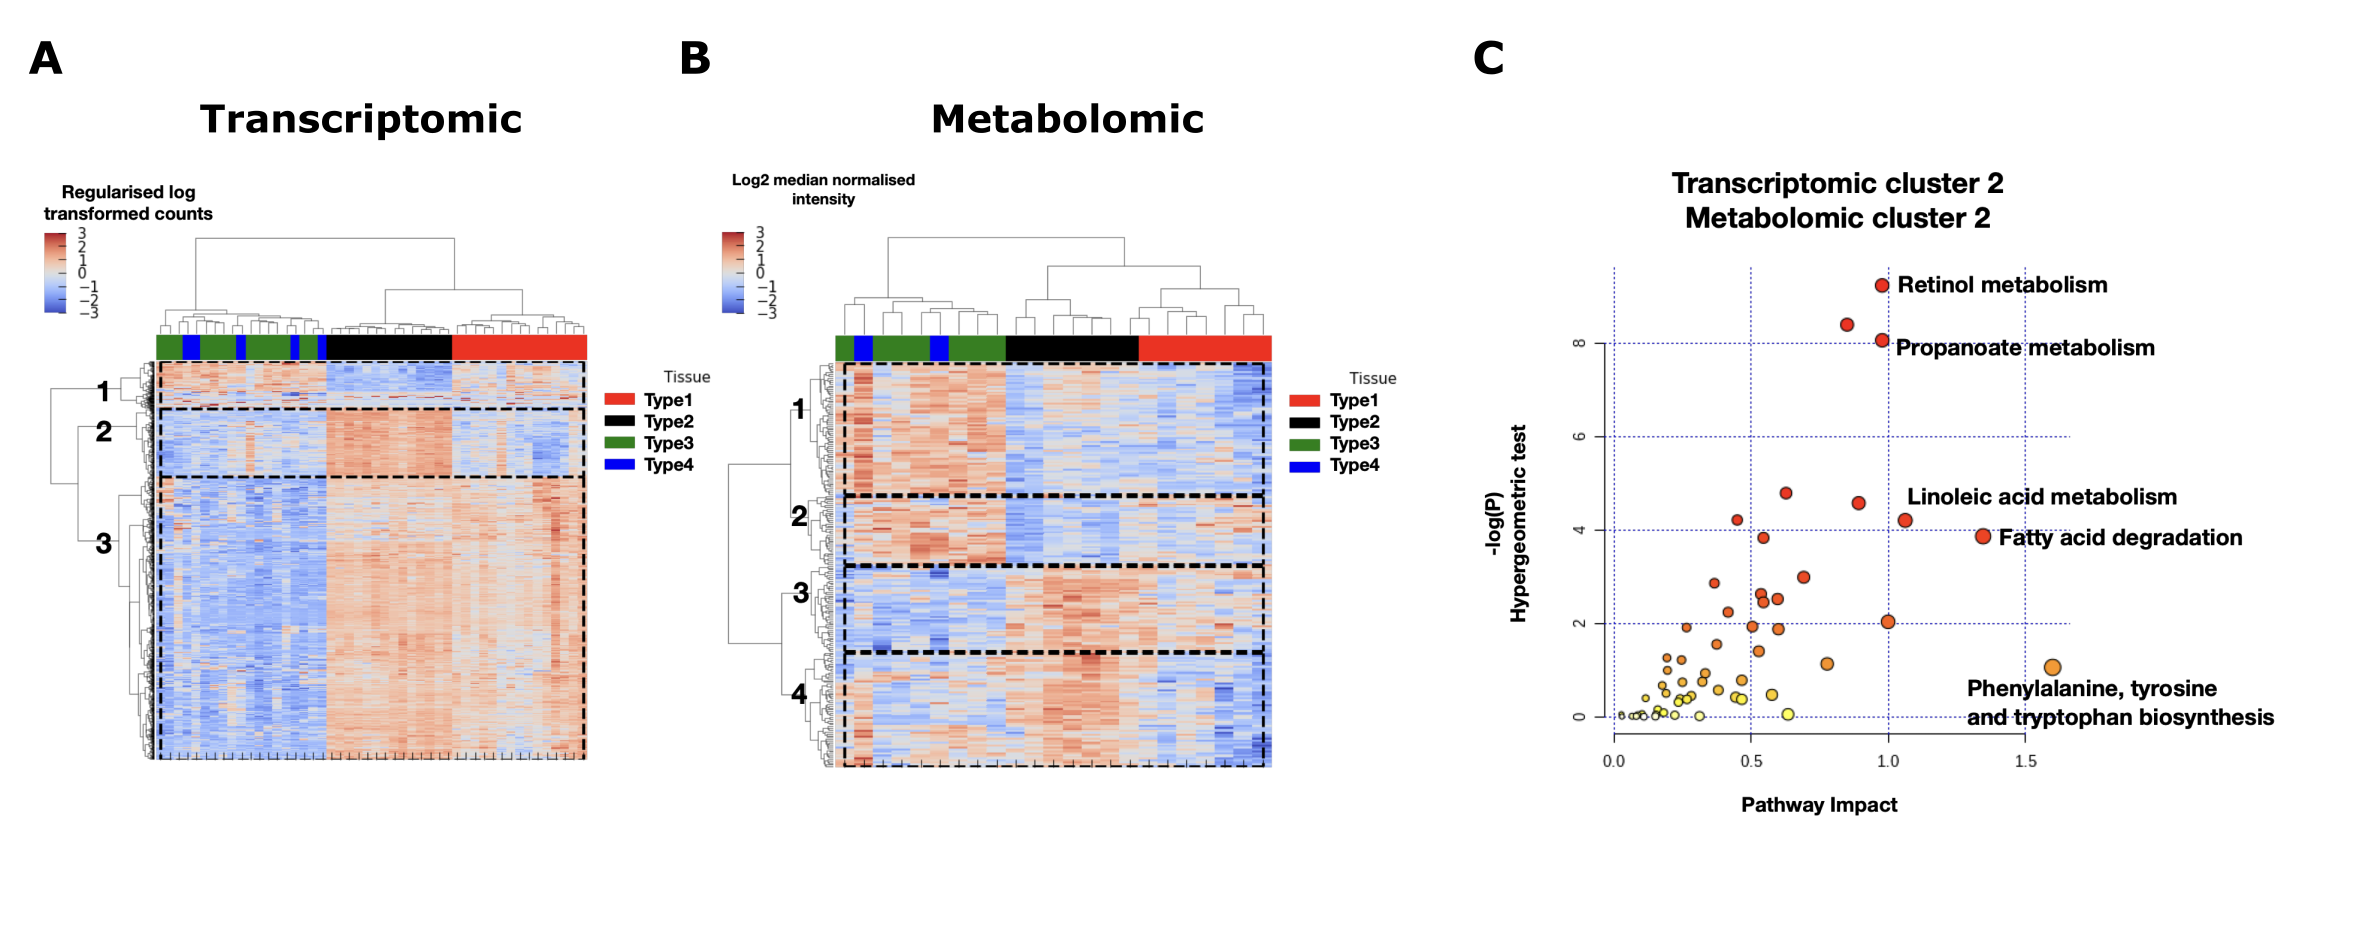
Figure 1. (A) Hierarchical clustering in the genes and samples space of the transcriptomic matrix for significantly differentially expressed genes between tissue types. (B) Hierarchical clustering in the metabolites and samples space of the metabolomic matrix for significantly differentially represented metabolites between tissue types. (C) Given a subset of genes and metabolites we can recover metabolic pathway in which both of those genes and metabolites are over-represented.
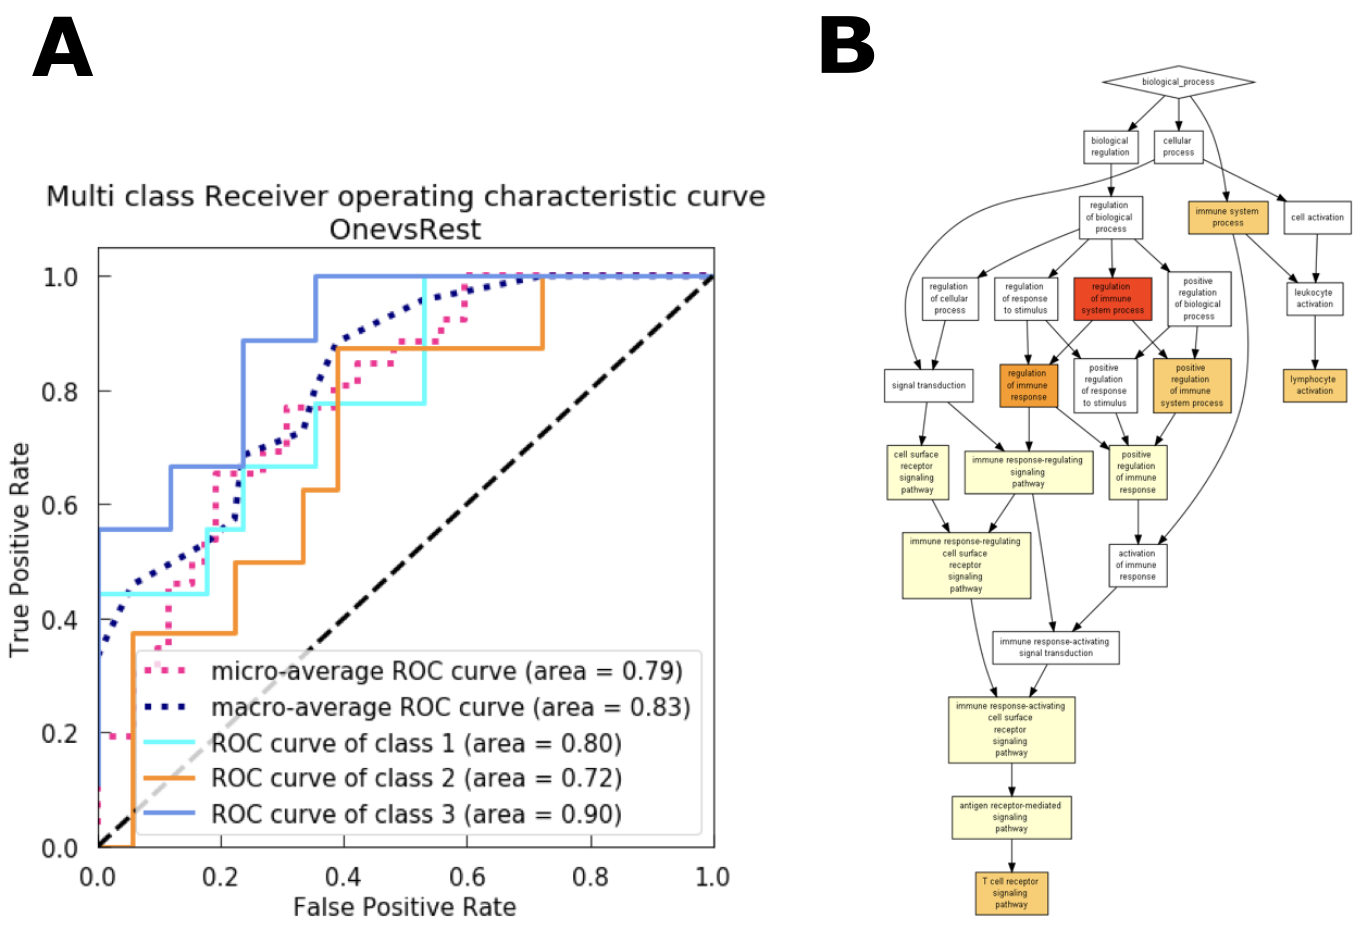
¶ Figure 2. (A) Using a Support Vector Machine algorithm to recover boundaries separating the different immune classes in the gene space of a transcriptomic experiment. (B) GO terms enrichment analysis according to important genes defining the boundaries between one of the classes and the others.