Transcriptomic and metabolic classification of distinct hepatocelluar carcinoma cancer-immune phenotypes
Keywords: hepatocarcinoma | immune system | multiomic | statistical modeling | machine learning
Project coordinator: Markus Heim, Qian Chen
CeDA collaborator: Sébastien Boyer
Project objectives
- Characterizing at the gene expression level the impact of immunophenotype on tumor cell metabolism
- Characterizing the extent of similarities and differences between tumor biopsies and a proposed experimental model (a tumor developing in an immune system-free environment: xenograft) to study the impact of immune system on tumor development
Approaches
- Metabolomic and transcriptomic measurement for 3 tissues types (i.e. non tumors, tumors and xenograft) coming from the same patient, for many patients
- Integration of discovered metabolites and genes significantly differentially expressed/measured between those 3 tissue types, within a metabolic pathway.
- For a set of tumors where the immunophenotype has been previously determined, find the principal axes that differentiate those phenotypes in the gene expression space
Analytical methods
- Linear model fitting and statistics:
- Using the framework DESEQ2 based on Generalized Linear Model to analyze transcriptomic data
- Using home-made linear model and ANOVA pipeline to analyze metabolomic data
- Machine learning:
- Using dimensionality reduction tools for visualization and interpretation, like Principal Component Analysis
- Using unsupervised learning methods like Hierarchical Clustering for gene/sample clusters discovery
- Using supervised learning methods like Support Vector Machine to recover and interpret differences between groups
- Multi Omics integrative statistics:
- Using over-representation analysis (hypergeometric statistics) to condense and translate transcriptomic and metabolomic data to biologically meaningful pathways
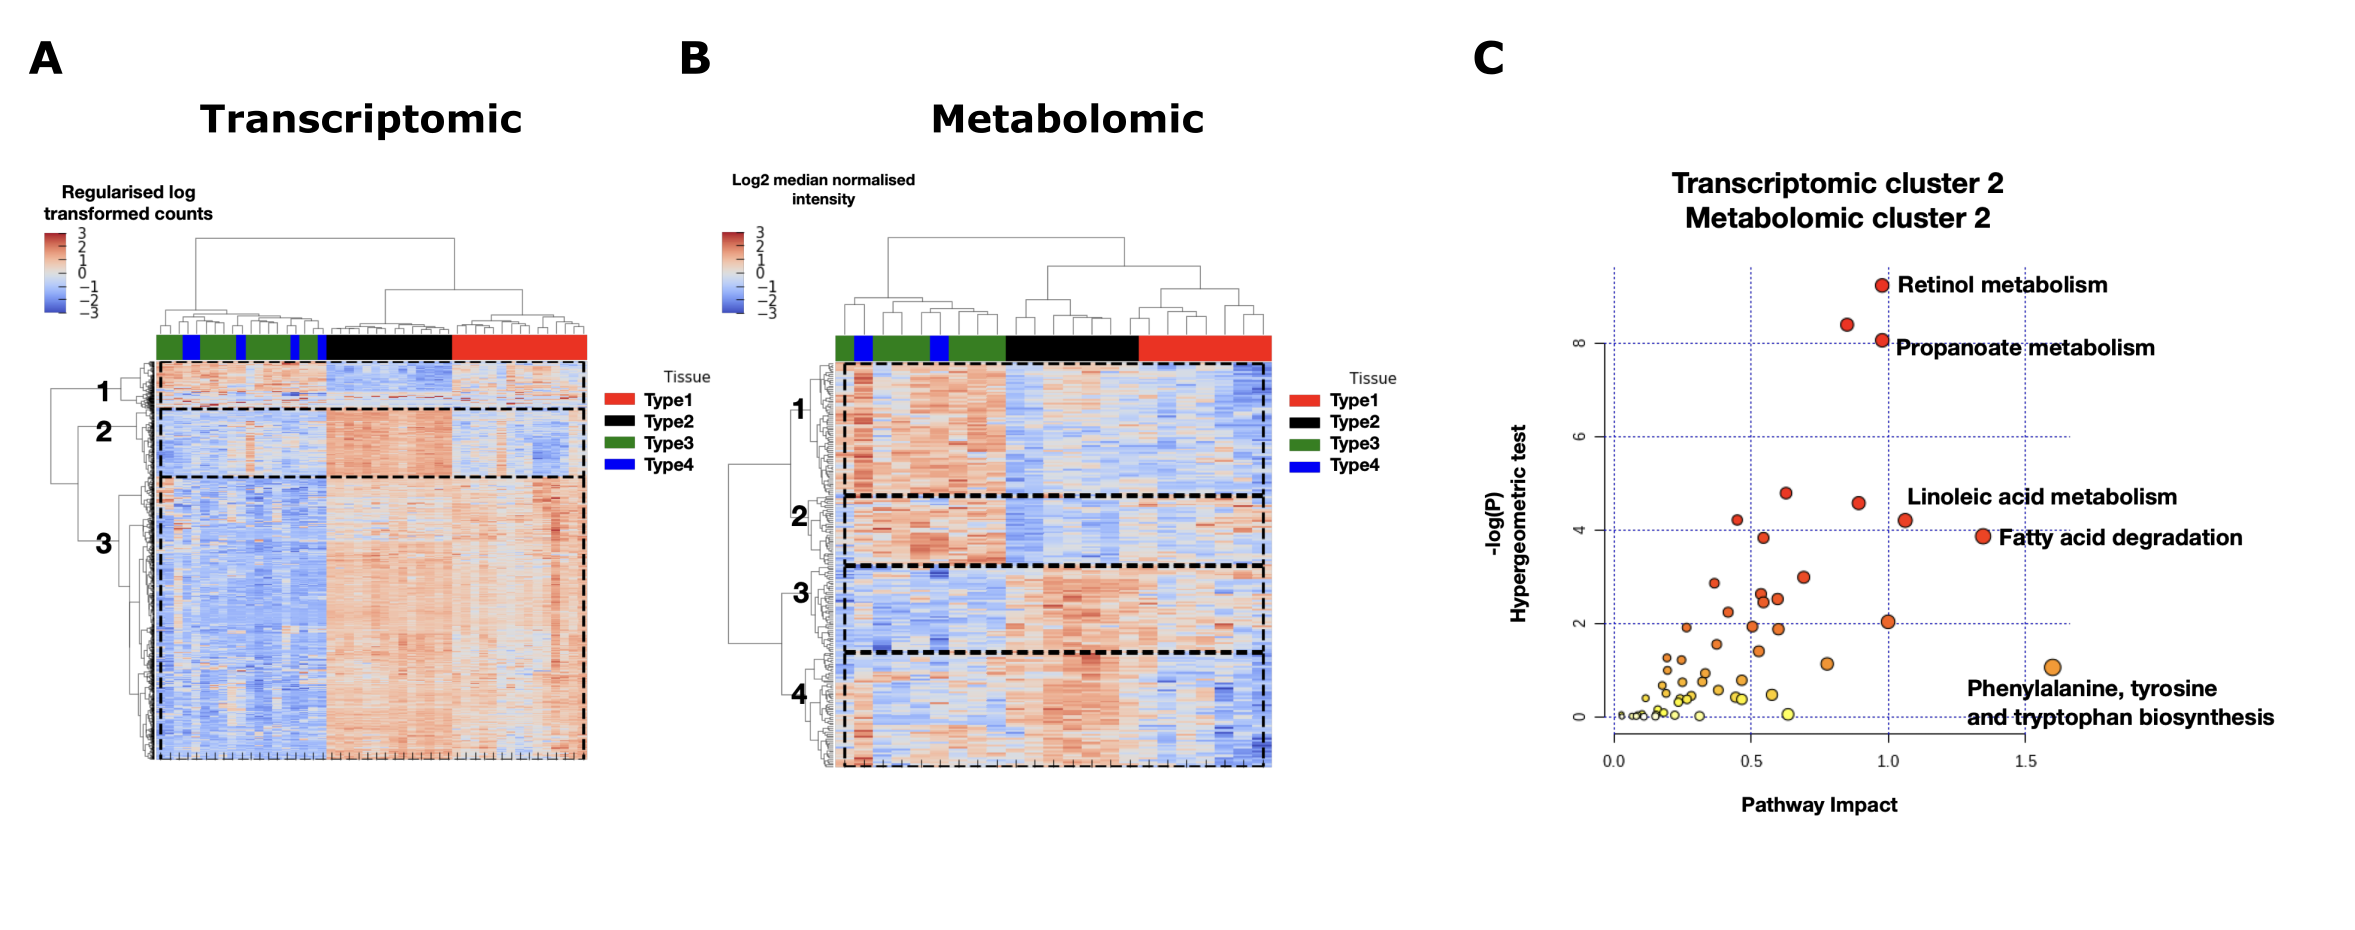
Figure 1. (A) Hierarchical clustering in the genes and samples space of the transcriptomic matrix for significantly differentially expressed genes between tissue types. (B) Hierarchical clustering in the metabolites and samples space of the metabolomic matrix for significantly differentially represented metabolites between tissue types. (C) Given a subset of genes and metabolites we can recover metabolic pathway in which both of those genes and metabolites are over-represented.
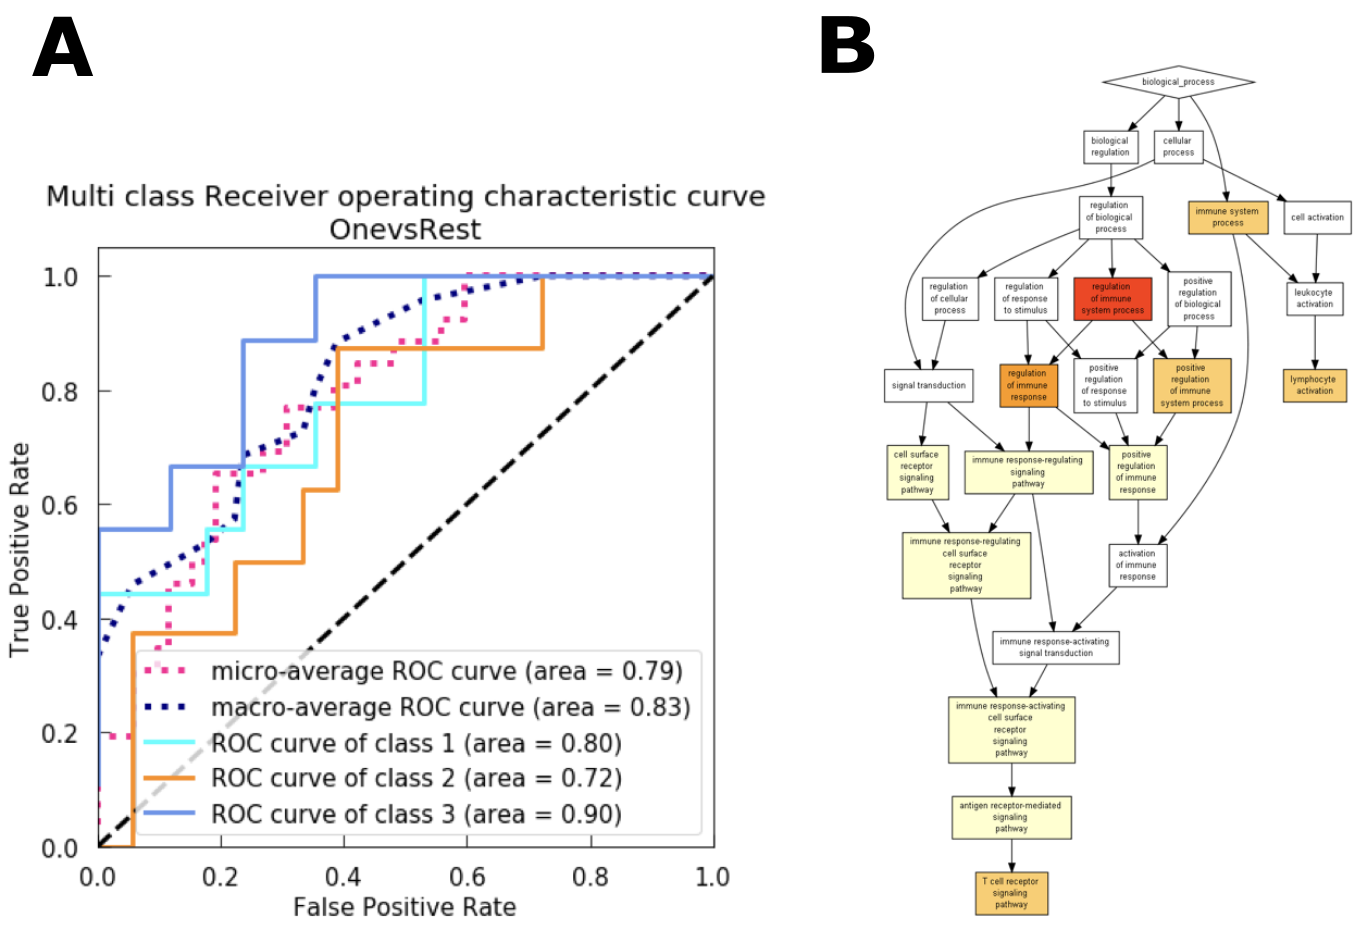
Figure 2. (A) Using a Support Vector Machine algorithm to recover boundaries separating the different immune classes in the gene space of a transcriptomic experiment. B) GO terms enrichment analysis according to important genes defining the boundaries between one of the classes and the others.